Create a funding landscape today
Leverage Candid's extensive grants data to visualize funding trends and identify gaps

By registering or logging in, you get access to detailed profiles and a personalized dashboard.

By registering or logging in, you get access to detailed profiles and a personalized dashboard.
Visualize where the money goes — and identify the gaps

Built on Candid's data, not just IRS 990 filings

See funding down to the grant, not just the organization

Decades of sector expertise, not just data

Interactive charts turn numbers into a clear story
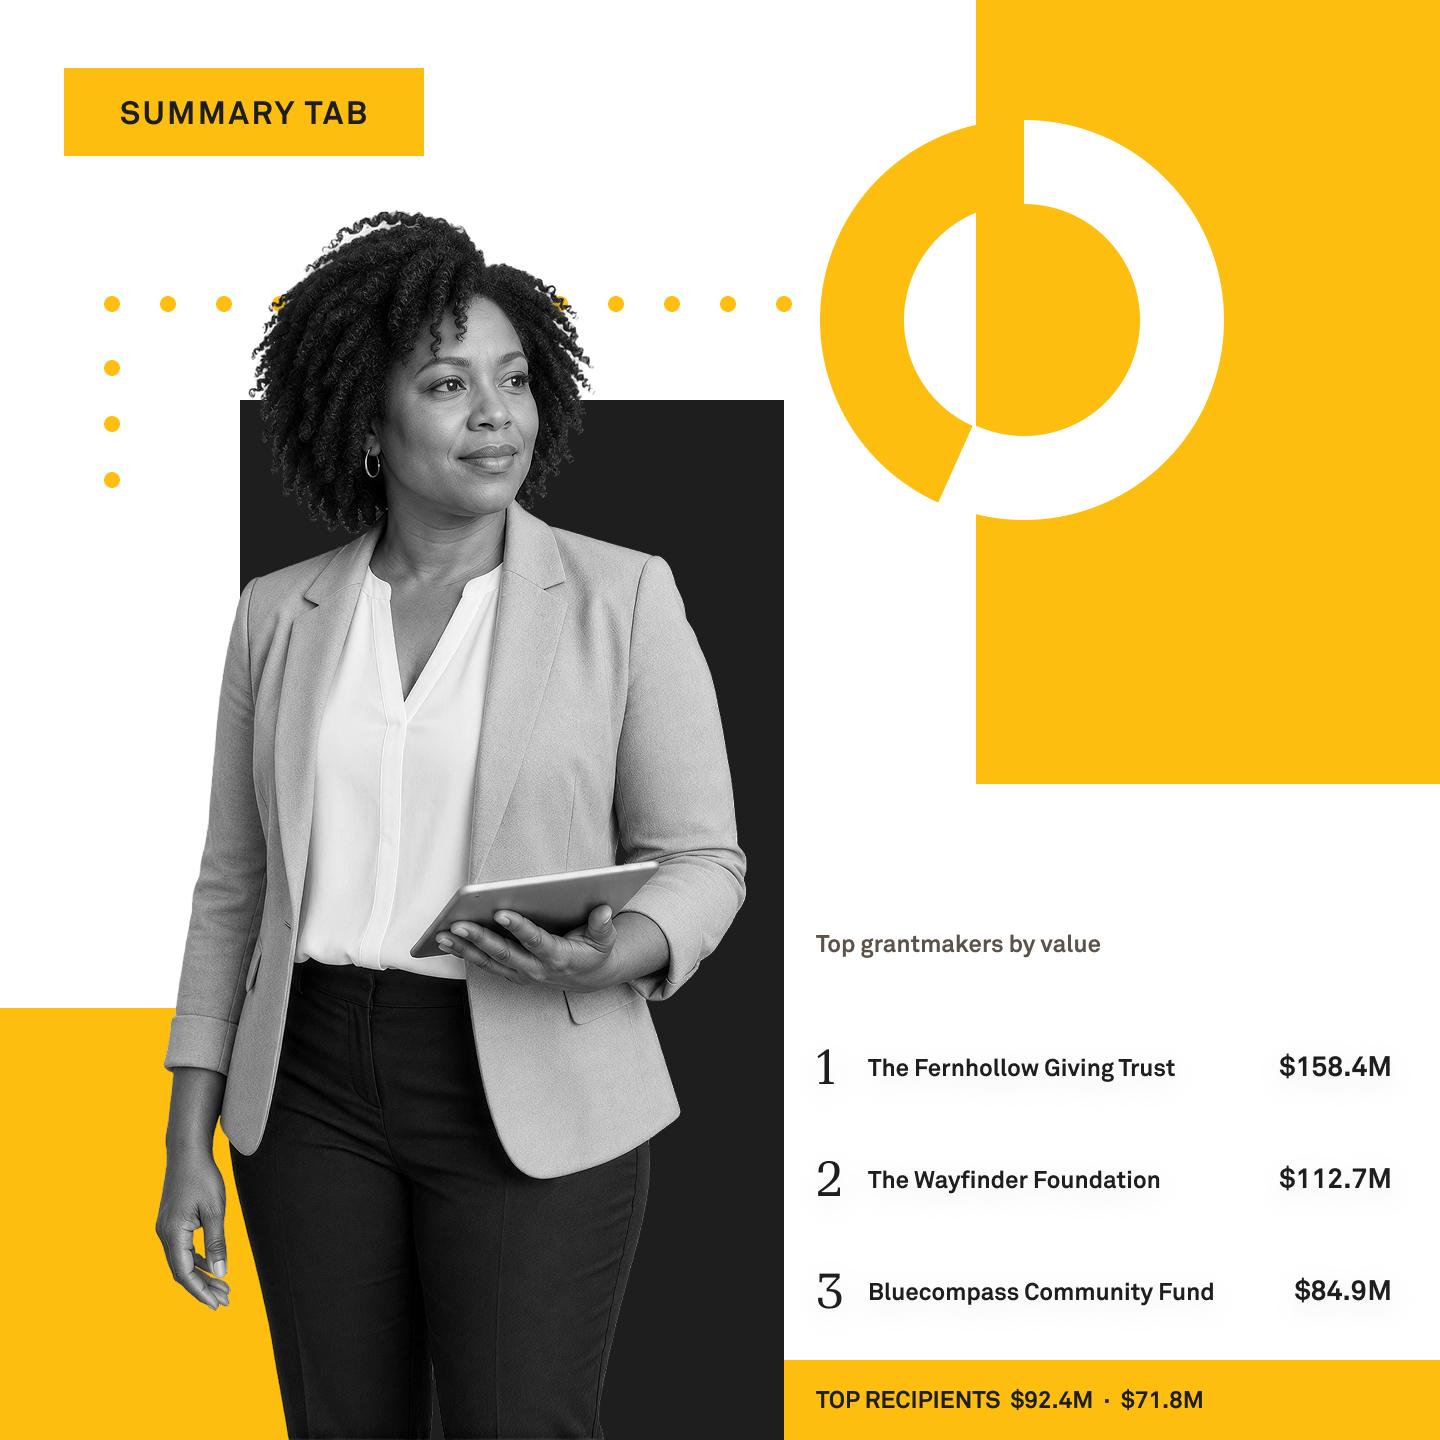
Our interactive landscape gives you an instant, visual snapshot of any cause: how many funders and nonprofits are in the space, the total dollars flowing in, and who the key players are. That view comes from Candid’s enriched data, not just IRS 990 filings, so you see fewer gaps and more accurate numbers.
Whether you’re a grantmaker, researcher, or nonprofit leader, you’ll have a clear, at-a-glance view of where the money goes and who’s doing the work.
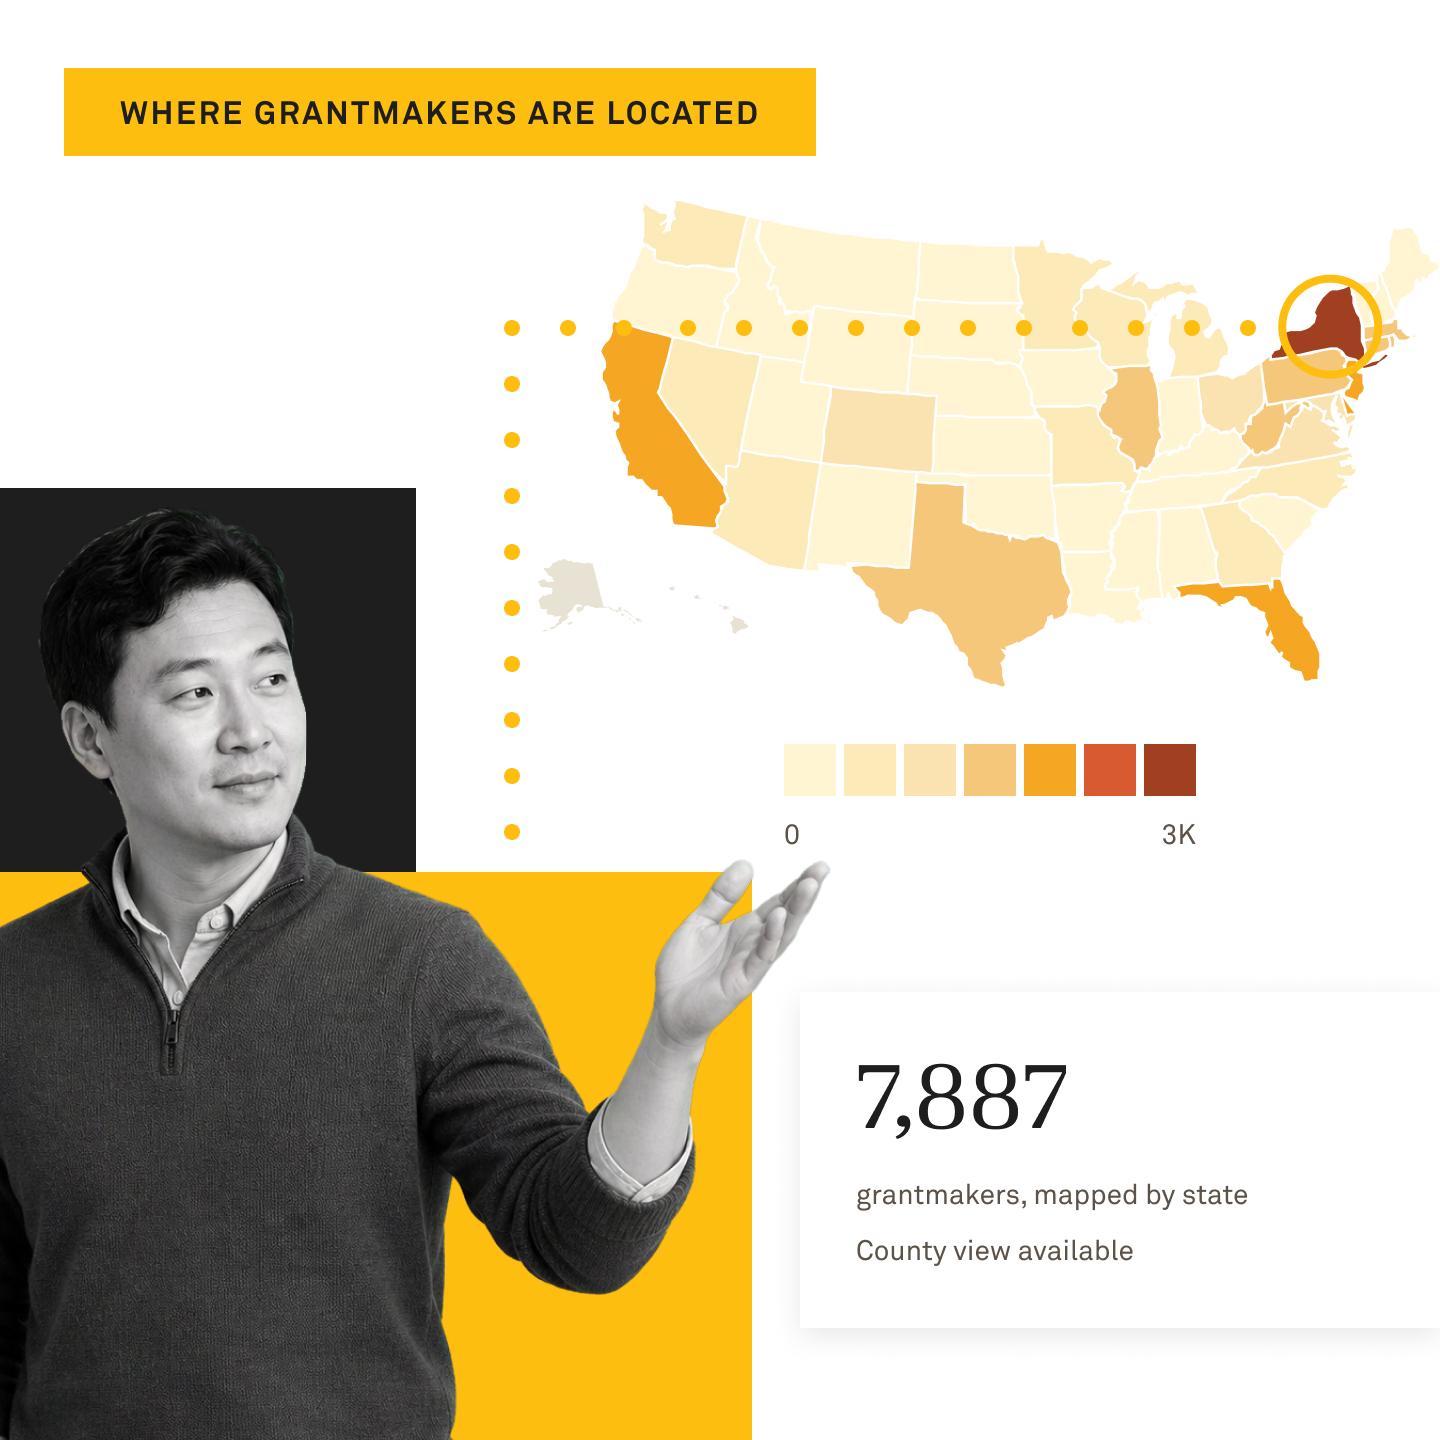
Landscapes make it easy to see and share funding patterns across regions and causes. Funding is coded using Candid’s Philanthropy Classification System, built for the field and reviewed regularly with input from the community.
Use these insights to spot funding trends and gaps, identify key players, and explore the scale and capacity of nonprofits in a cause. With better data, the whole sector gets stronger.
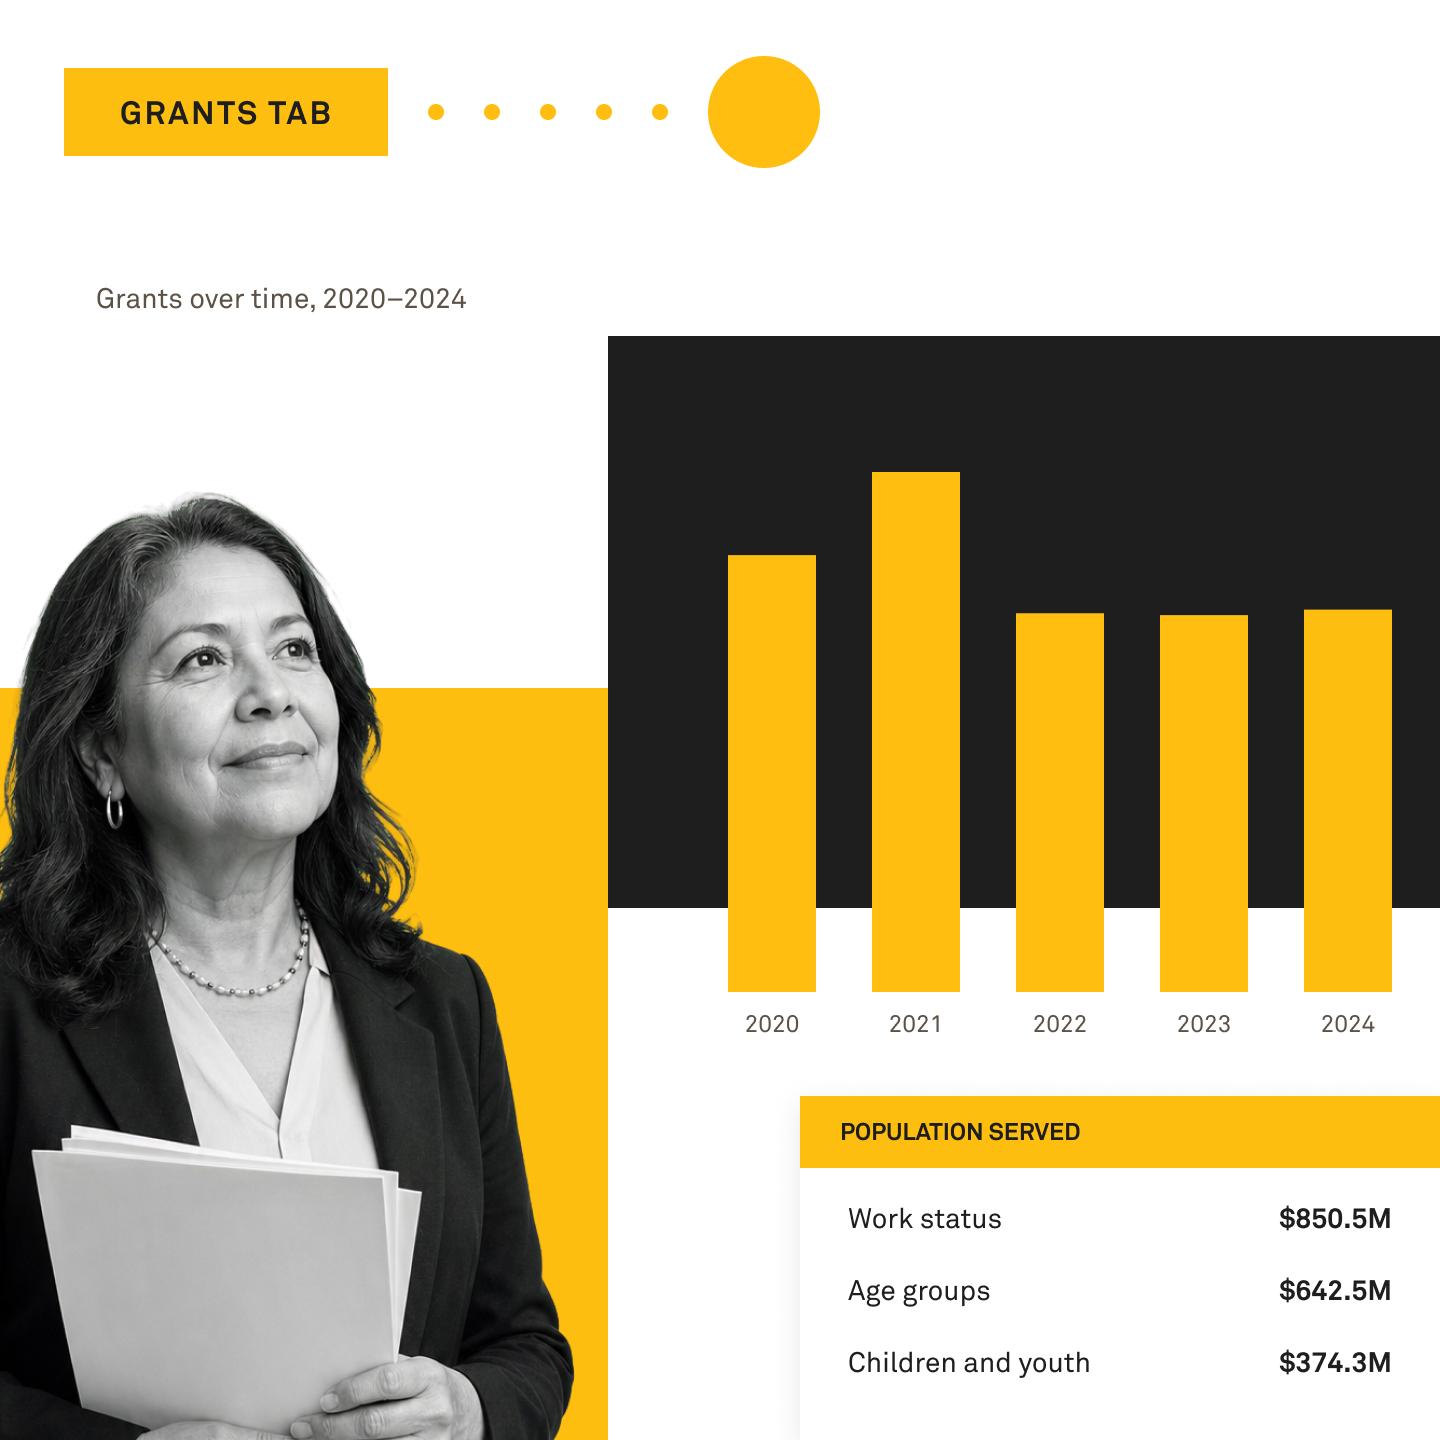
Understanding a cause means following the money. Our grants insights show typical grant sizes, funding trends over time, and a breakdown of who’s being served and where the money actually goes, coded at the grant level, not just the organization level.
Candid’s team brings decades of experience studying the philanthropic sector, and that depth shapes how we verify and structure the numbers, not just the data. Whether you’re benchmarking your giving or scoping a new cause area, you’ll get full context on how funding moves, backed by knowledge that built Landscapes.