Know your district: Nonprofit stats by congressional district
Use a free tool powered by Candid’s data to explore nonprofits stats by congressional district and understand how policy makers’ decisions like recent funding cuts impact local communities.

When policy makers debate funding cuts or policy changes, they often lack data about local impact. Candid’s latest interactive dashboard provides visibility into the scope and scale of the nonprofit ecosystem in each congressional district—essential information for advocates working to protect community services.
The tool, Nonprofit stats by congressional district, allows users to filter to any of the 435 U.S. House districts (plus Washington, D.C.) to reveal key metrics based on Candid’s latest available data:i the number of registered 501(c)(3) nonprofits, the number of nonprofit employees, aggregate revenue flowing to nonprofits, and the distribution of nonprofits by subsector (based on NTEE code) and organizational size (based on annual expenses.)ii
Simple stats, powerful insights into the nonprofit ecosystem
Nonprofit stats by congressional district shows that while the scale of the nonprofit ecosystem may vary between districts, those organizations are present across communities and contribute substantial economic activity everywhere. Urban districts like New York’s 12th (parts of Manhattan, with 735,000 residents), for example, have over 8,600 nonprofits generating $89 billion in annual revenue and employing more than 400,000 people. But even Wyoming’s only district—that is, the entire state—with a comparatively smaller population (588,000) and nonprofit ecosystem, still has over 4,000 nonprofits, generating $1.6 billion in revenue and providing over 17,000 jobs—meaningful economic impact in any community.
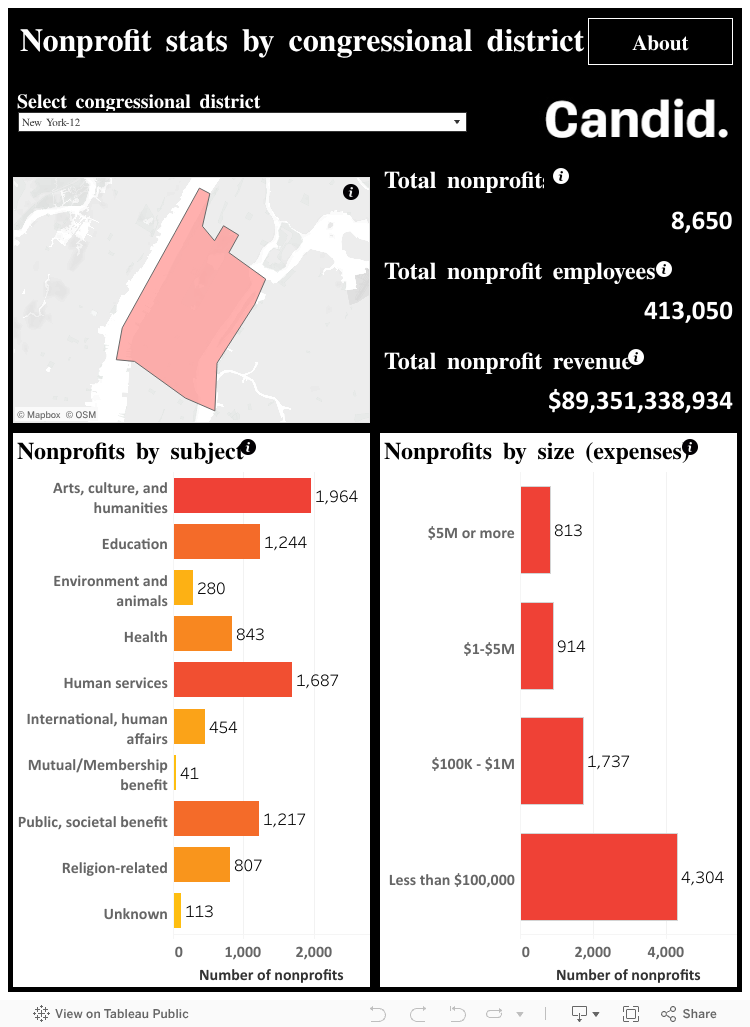
This view of the dashboard shows nonprofit stats for New York’s 12th Congressional District. Feel free to adjust the filters here to customize your view or explore the complete dashboard on Tableau Public.
The employment data offers useful context when considered alongside discussions about the changing federal policy environment. Over the past few months, nonprofits and funders have been assessing potential impacts from reduced government funding and other threats to the sector’s stability. The district-level employment figures help quantify what those changes could mean for local job markets. In some districts, nonprofit employment represents a substantial portion of the workforce, making the sector’s stability an economic issue for local communities.
Distribution patterns by nonprofit types and sizes across congressional districts
Two key features of the tool—breaking down nonprofit stats by subject area and by organizational size—reveal important patterns about how nonprofits are distributed within districts.
The breakdown by subject area demonstrates that human services nonprofits consistently outnumber those in other categories, regardless of whether districts are urban, rural, or mixed.iii For example, in Wisconsin’s predominantly rural 7th district, 34% of nonprofits identify as human services organizations, as do 33% of nonprofits in Illinois’s largely urban 2nd district. The dominance of this category reflects the universal need for food assistance, housing support, family services, and emergency aid, but it also means that funding disruptions to human services programs could have a large impact across all districts.
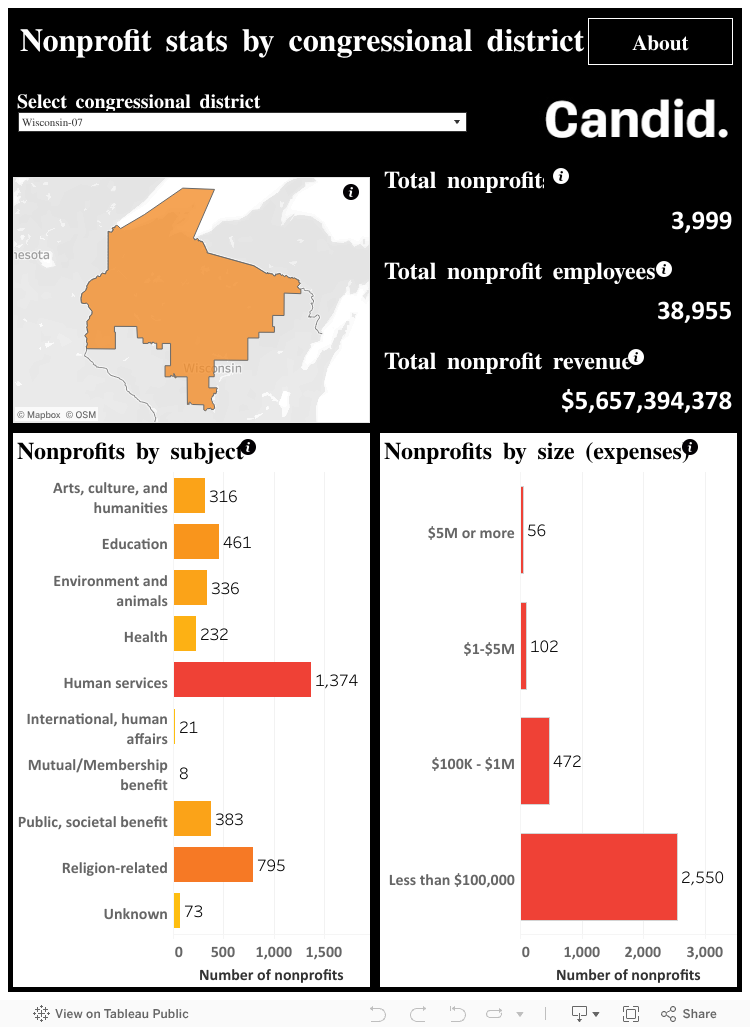
This view of the dashboard shows nonprofit stats for Wisconsin’s 7th Congressional District. Feel free to adjust the filters here to customize your view or explore the complete dashboard on Tableau Public.
The tool’s expense-based size categories (and additional research by Candid) reveal that the majority of nonprofits in most every district are very small, with budgets under $100,000, suggesting high vulnerability to funding disruptions. Together, these patterns—dominance of human services organizations and prevalence of small-budget nonprofits—paint a picture of a sector where the most essential services are delivered by the most financially vulnerable organizations.
Building evidence for impact with nonprofit stats by congressional district
Across the United States, nonprofit organizations form the backbone of civic life and “get it done”—filling gaps in government services, generating economic activity, and addressing community needs with local knowledge. Yet their contributions frequently go unmeasured and unrecognized in policy discussions.
Tools like this are designed to help change that dynamic by providing the evidence base necessary for more informed advocacy efforts. As the nonprofit sector navigates an uncertain policy landscape, nonprofit stats by congressional district can transform how nonprofit sector leaders can make their case. When they combine demonstrated need with evidence of local economic impact and proof of community presence, they’re better positioned to build the coalitions necessary to sustain the vital work nonprofits do.
i Data sources include the IRS Business Master File (BMF) and Form 990 filings from nonprofits required to file them. While most data reflects 2024 or 2023 filings, older data (going back to 2020) is used when more recent filings are unavailable.
ii The full dataset across all districts includes 1,470,258 501(c)(3) public charities. Private foundations and non-501(c)(3) nonprofits—such as 501(c)(4)s and 501(c)(6)s)— are excluded. Counts for nonprofit employment are only available for the 280,298 larger nonprofits (which are also more likely to employ staff). Revenue figures are available only for the 477,996 nonprofits filing IRS Forms 990 or 990-EZ. The result is that the number presented approximate but ultimately undercount the true employment and revenue figures in each district. When calculating expenses categories, we assign the smallest nonprofits filing Forms 990-N into the category of $100,000 or less in expenses.
iii The exception to this is that, in some districts, religion-related nonprofits rank above human services nonprofits as the single largest type. Interestingly, the dominance of religion-related nonprofits does not favor rural districts as one might think. For example, in LA’s 34th congressional district, religion-related nonprofits are the most common.

